Case study 02 / 03
Data ProfessionalSalary Survey/Power BI
Overview
This project turns the Brent Ozar Unlimited Data Professional Salary Survey into a structured Power BI report covering reported pay, technology, experience and career plans.
The report was developed as an end-to-end BI solution rather than a collection of charts. It includes Power Query cleaning, dimensional modelling, explicit DAX measures, sample-size controls, report navigation, row-level security and a dedicated quality-assurance page.
- Contribution
- Data cleaning, dimensional modelling, DAX development, report design, row-level security and report validation.
- Deliverables
- Four-page interactive Power BI report
- Documented dimensional model and measure definitions
- PBIX report, PDF export and supporting documentation
- Primary tools
- Power BI · Power Query · DAX · Excel
Questions & Scope
The source contains self-reported responses from the 2017–2026 Data Professional Salary Surveys. It includes salary, role, experience, database, hosting, career-plan and demographic information.
The report was designed to investigate questions such as:
- How does reported salary vary across countries, roles, technologies and sectors?
- Is there a reported salary difference between respondents who manage staff and those who do not?
- How does reported salary vary with years in role?
- Which databases and hosting environments appear most frequently?
- What career plans do respondents report?
The default report view focuses on full-time employees and full-time employees of consulting or contracting companies. Users can change the filters when they need a different scope.
Data Preparation & Quality
The source contained user-entered survey values that were not immediately suitable for consistent analysis. Power Query was used to clean, standardise and reshape those fields before they entered the model.
Important preparation tasks included:
- excluding unusable salary values from yearly salary analysis,
- interpreting experience entered either as years or as a starting year,
- simplifying long company-count labels,
- handling values such as
Not Asked, - separating optional comma-delimited hosting selections,
- retaining raw context while exposing cleaner reporting fields,
- checking salary coverage and respondent counts.
Salary measures use cleaned salary values rather than the original raw response field. Categories with insufficient valid salary responses can be hidden through the report’s sample-size control.
Hosting required special treatment because one respondent could select several hosting options. Splitting the values into rows enabled a proper bridge-table design instead of forcing a single hosting category onto each response.
Data Model
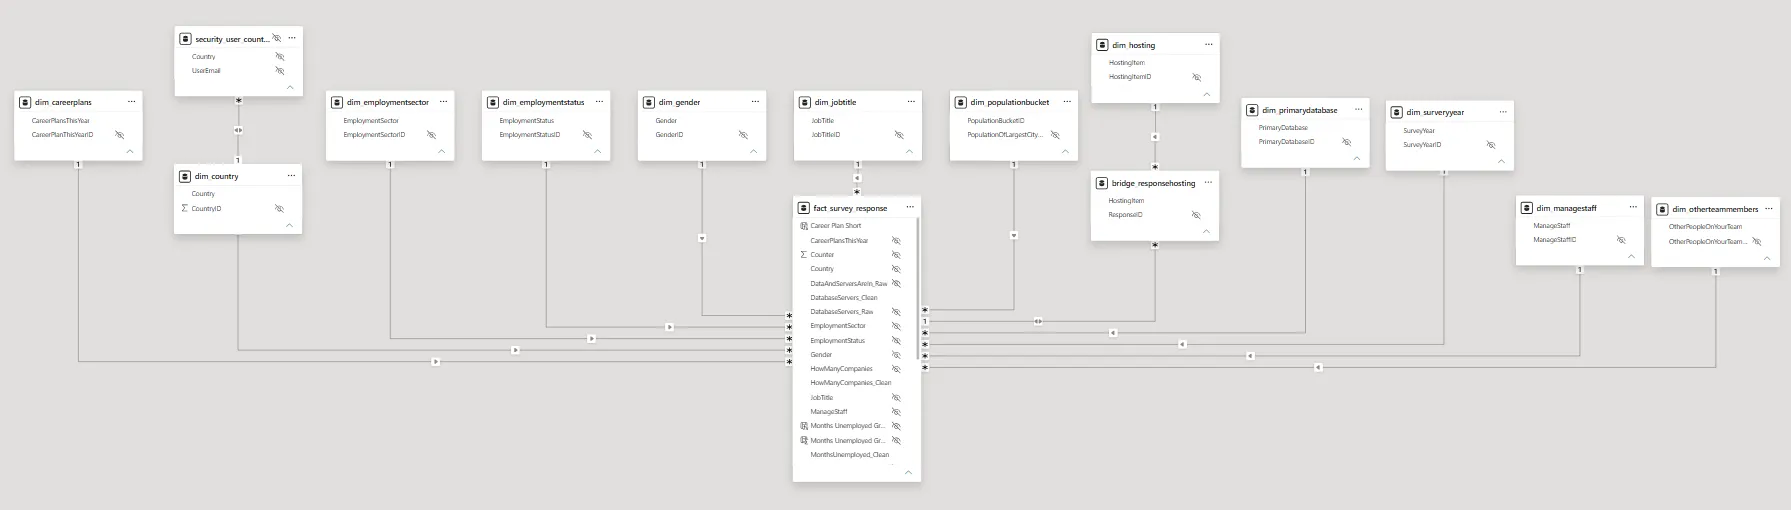
The final model uses one row per survey response in fact_survey_response. Dimension tables provide consistent filtering for country, job title, primary database, survey year, employment status, sector, gender, management status, career plans, city population and team size.
Multi-select hosting responses are represented through bridge_responsehosting. This allows one survey response to relate to several hosting items without duplicating the main fact row.
A separate _Measures table keeps explicit report measures organised. Country-based security uses a user-to-country mapping table connected to the country dimension and survey fact.
Measures & Report Controls
The report uses explicit measures for respondents, full-time respondents, valid salary respondents, salary response rate, median salary, IQR-trimmed median salary, manager premium and hosting response rate.
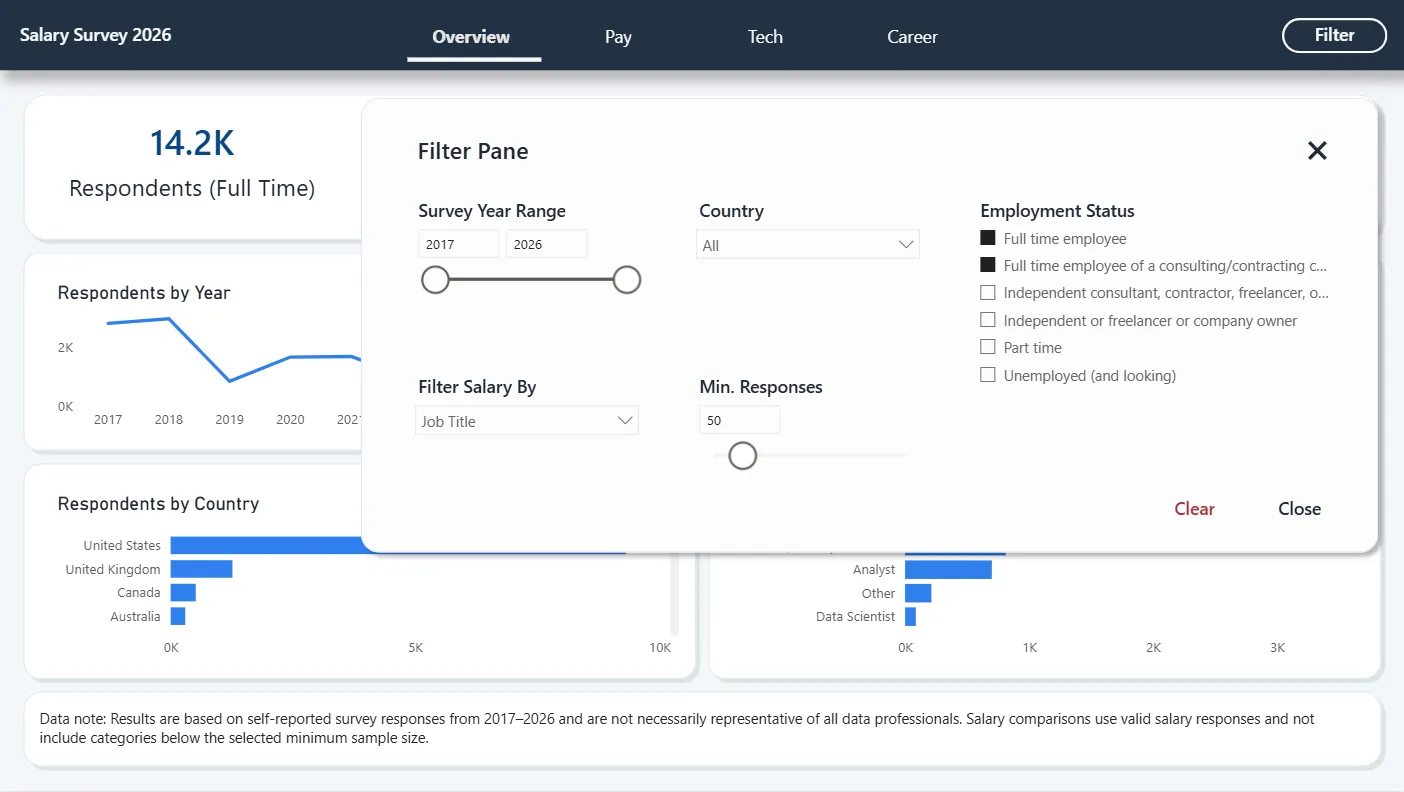
Salary comparisons use a configurable minimum sample-size rule. Categories below the selected threshold return blank or are hidden from the relevant visual. The default threshold is 50 valid salary respondents.
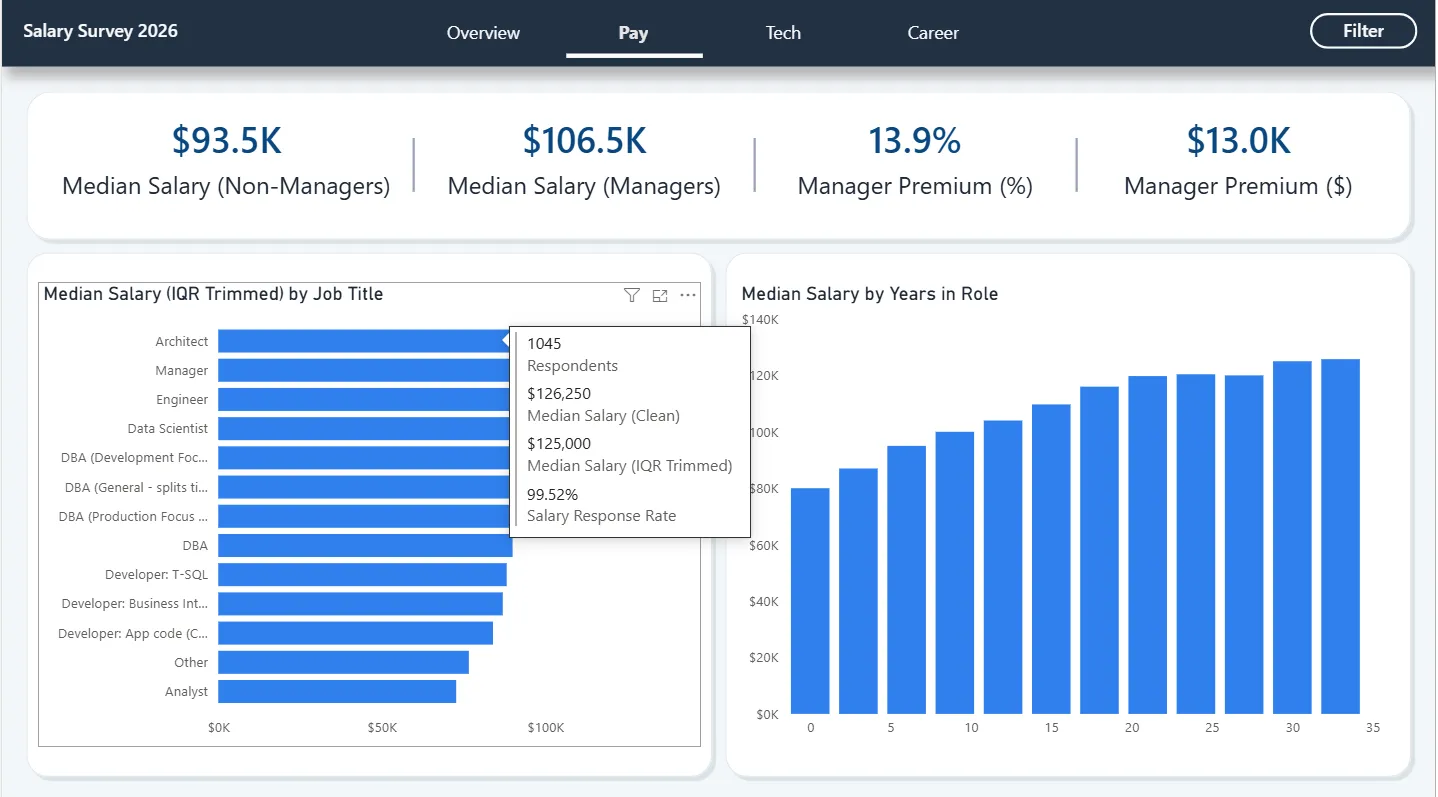
The Pay page also uses a field parameter that lets users change the salary comparison between country, job title, primary database, city size, hosting item, gender and employment sector.
Additional report controls include:
- a bookmark-based filter pane,
- synced slicers,
- report-page navigation,
- a salary tooltip page,
- contextual explanatory text,
- a hidden QA page.
Dashboard Experience
The report is divided into four main pages. Each page answers a different group of questions while retaining shared filters and navigation.
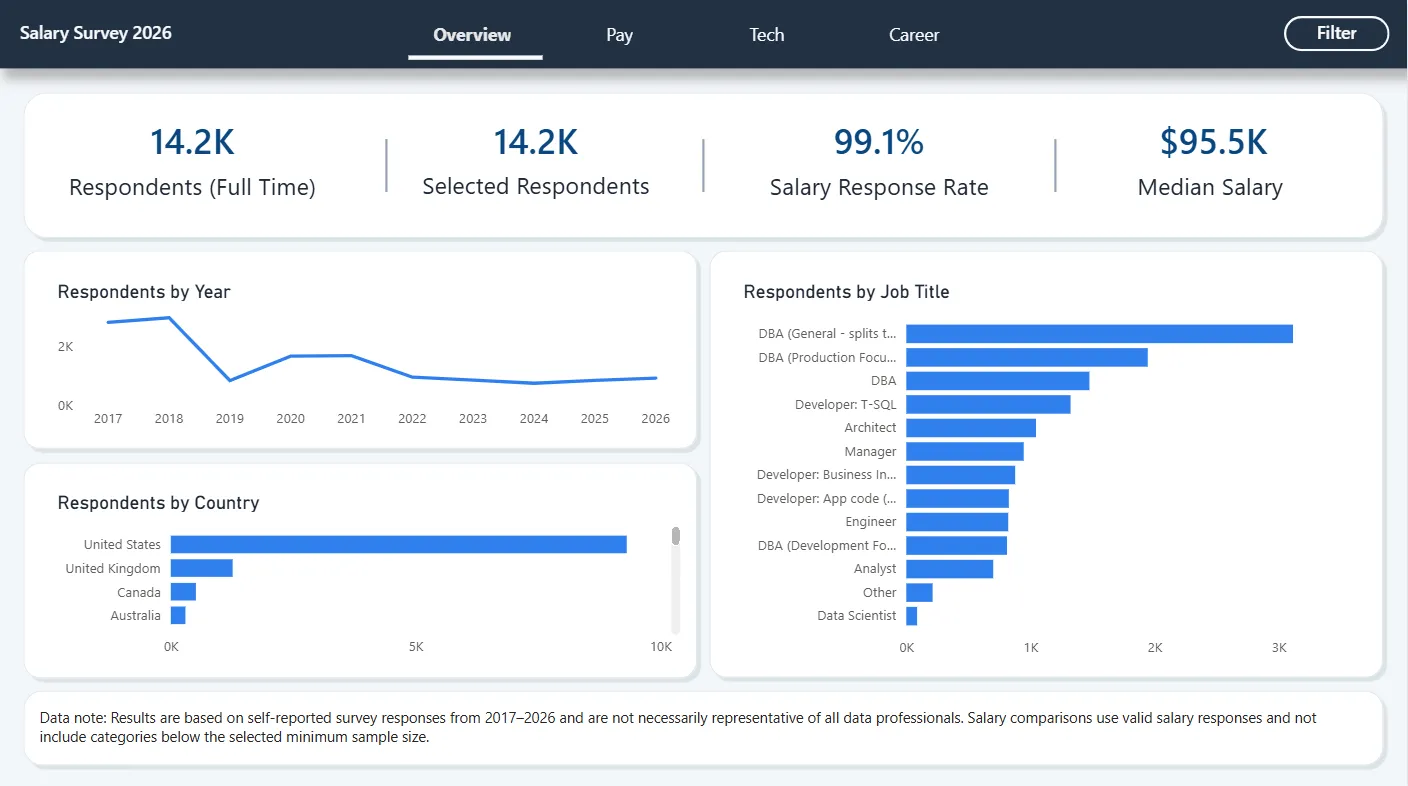
Overview
Summarises the selected cohort, salary coverage, management comparison and high-level respondent characteristics.
Pay
Focuses on reported salary by the selected field parameter and years in role. Minimum sample-size controls reduce unreliable comparisons.
Tech
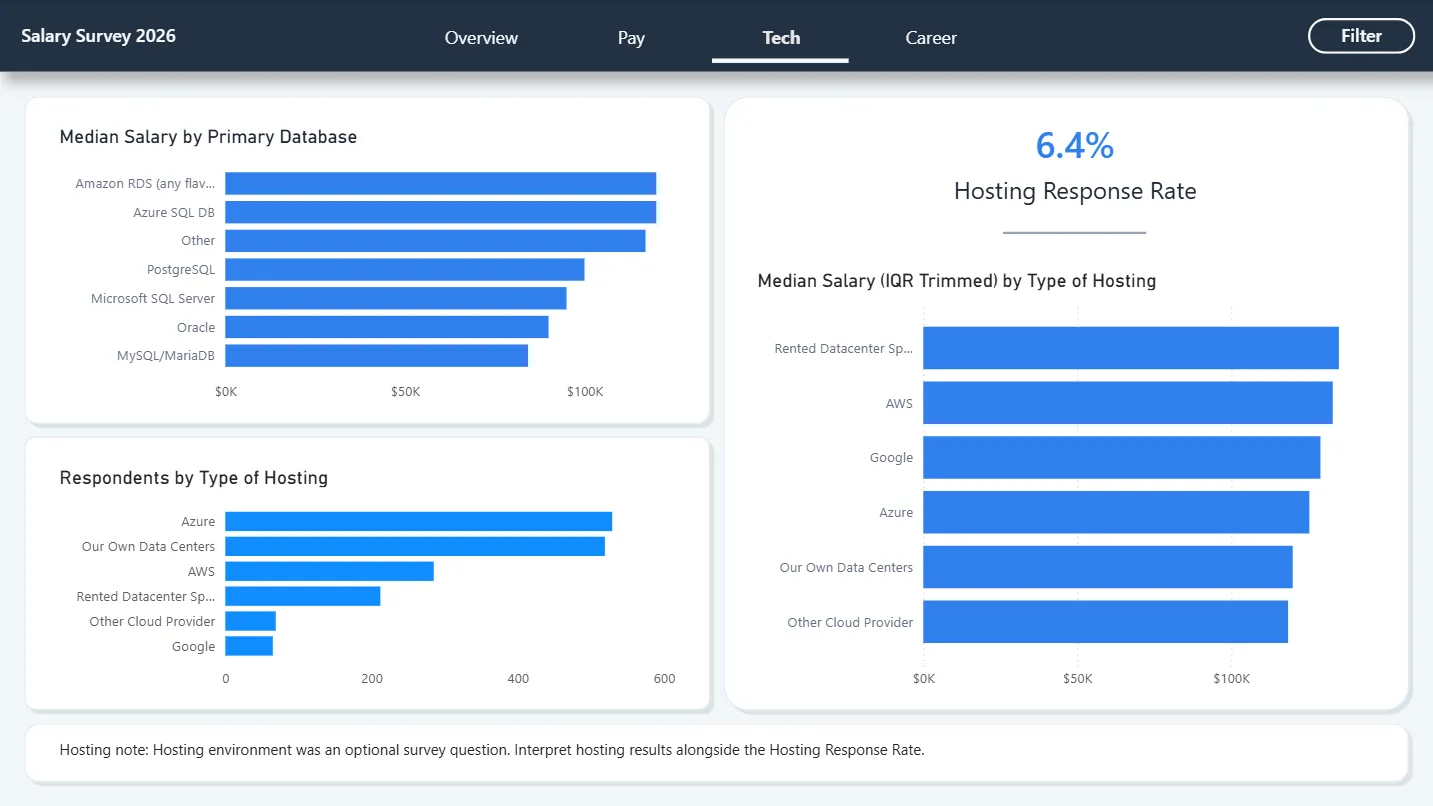
Explores primary databases and multi-select hosting responses while clearly distinguishing respondents from hosting selections.
Career
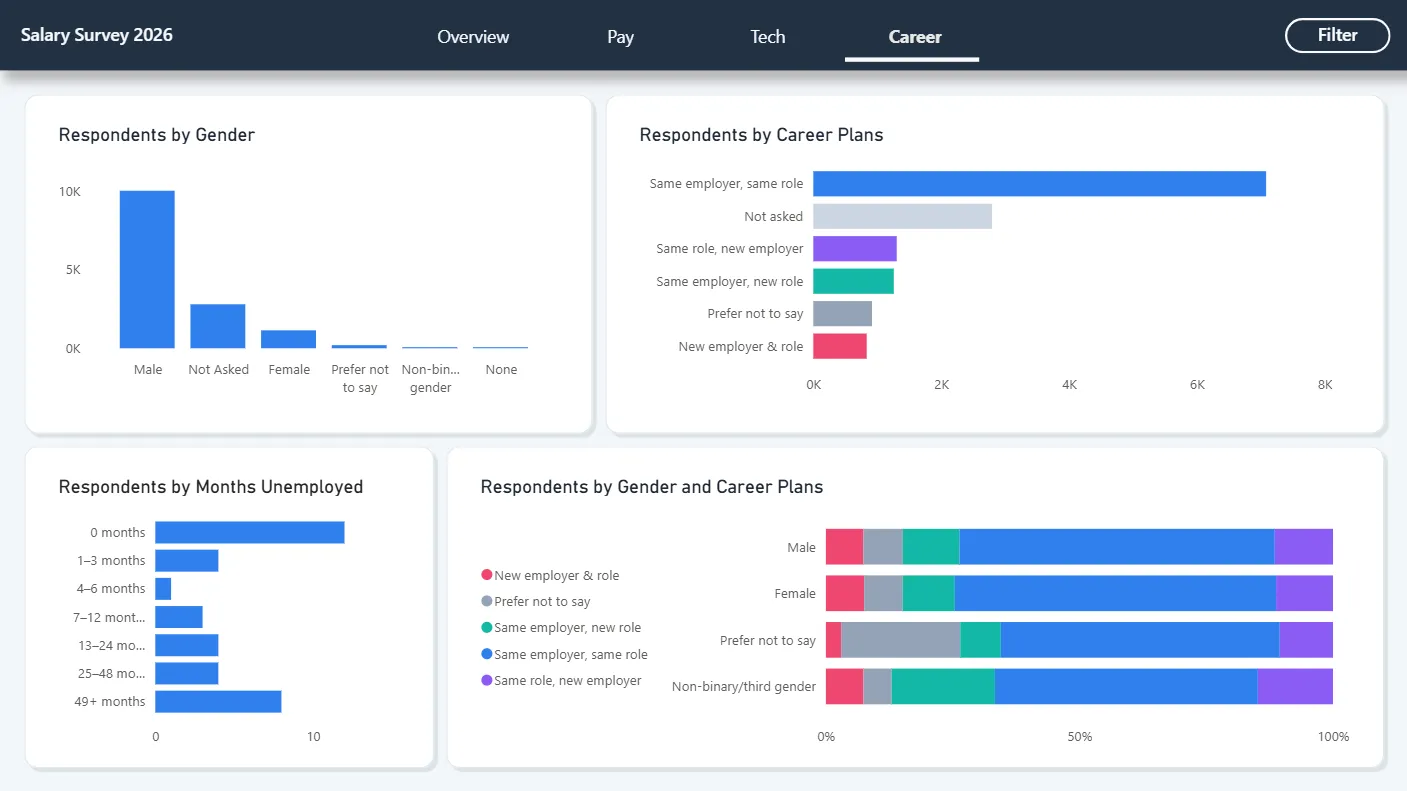
Presents career plans and selected respondent characteristics for the active filter context.
Key Findings
The following figures use the default report state unless stated otherwise.
- ~14.2KFull-time respondentsApproximate size of the default report cohort.
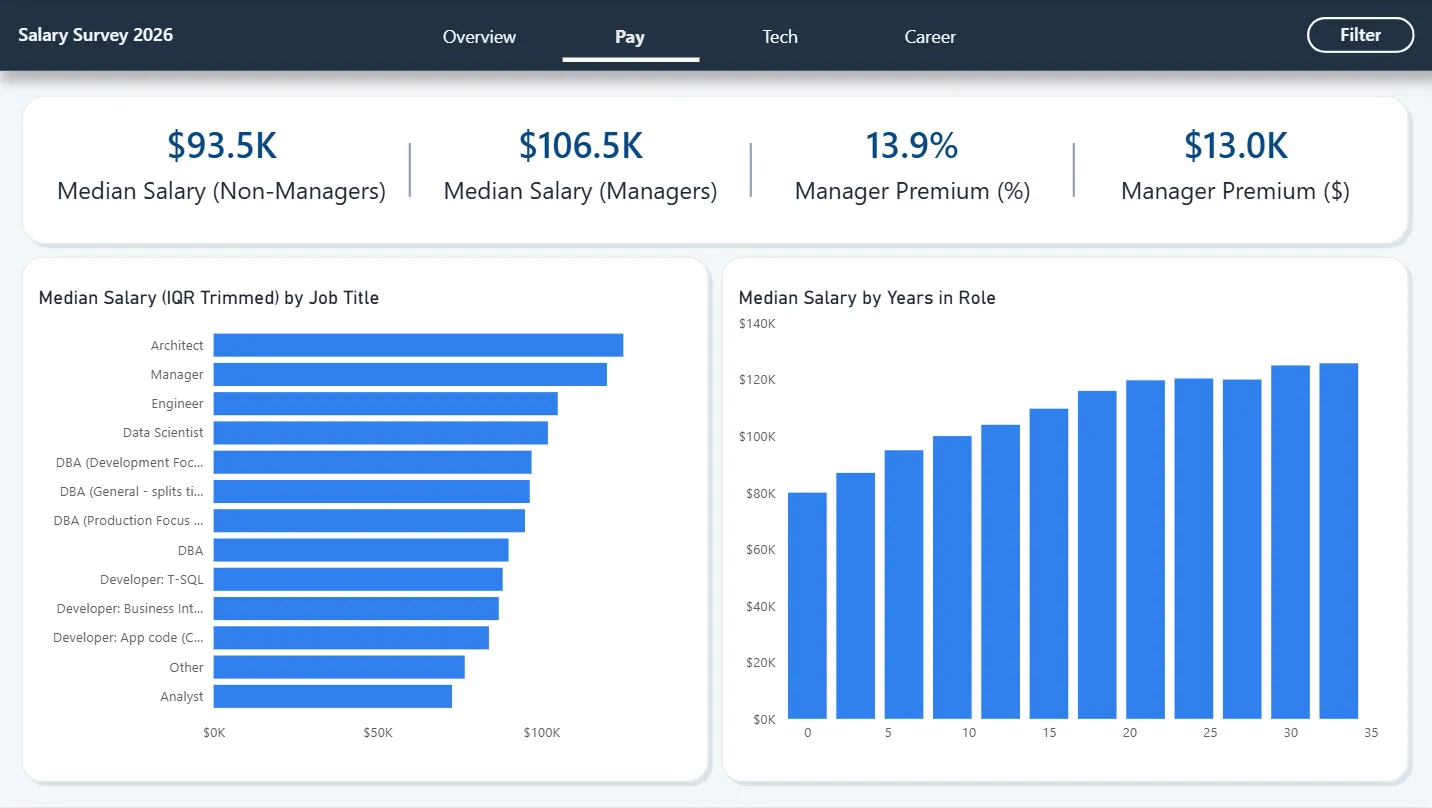
- $106.5KManager median salaryReported median for respondents who manage staff.
- $93.5KNon-manager median salaryReported median for respondents who do not manage staff.
Managers reported a median salary of $106.5K, compared with $93.5K for non-managers. The reported difference is $13K, or 13.9%. This is a descriptive comparison and does not establish that management responsibility caused the difference.
Among job-title categories with at least 50 valid salary respondents, Architects had the highest IQR-trimmed median salary at $125K. Managers followed at $120K and Engineers at $105K.
Reported median salary rises most clearly during the first 20 years in role and then becomes flatter. The higher-experience groups contain fewer respondents, so those later comparisons require more caution.
Azure was the most frequently reported hosting item among respondents who answered the optional hosting question. Hosting results represent a smaller subset of the survey and categories overlap because the question allowed multiple selections.
QA, RLS & Limitations
A hidden QA page supports checks for imported response counts, salary coverage, model behaviour, filter context and row-level security.
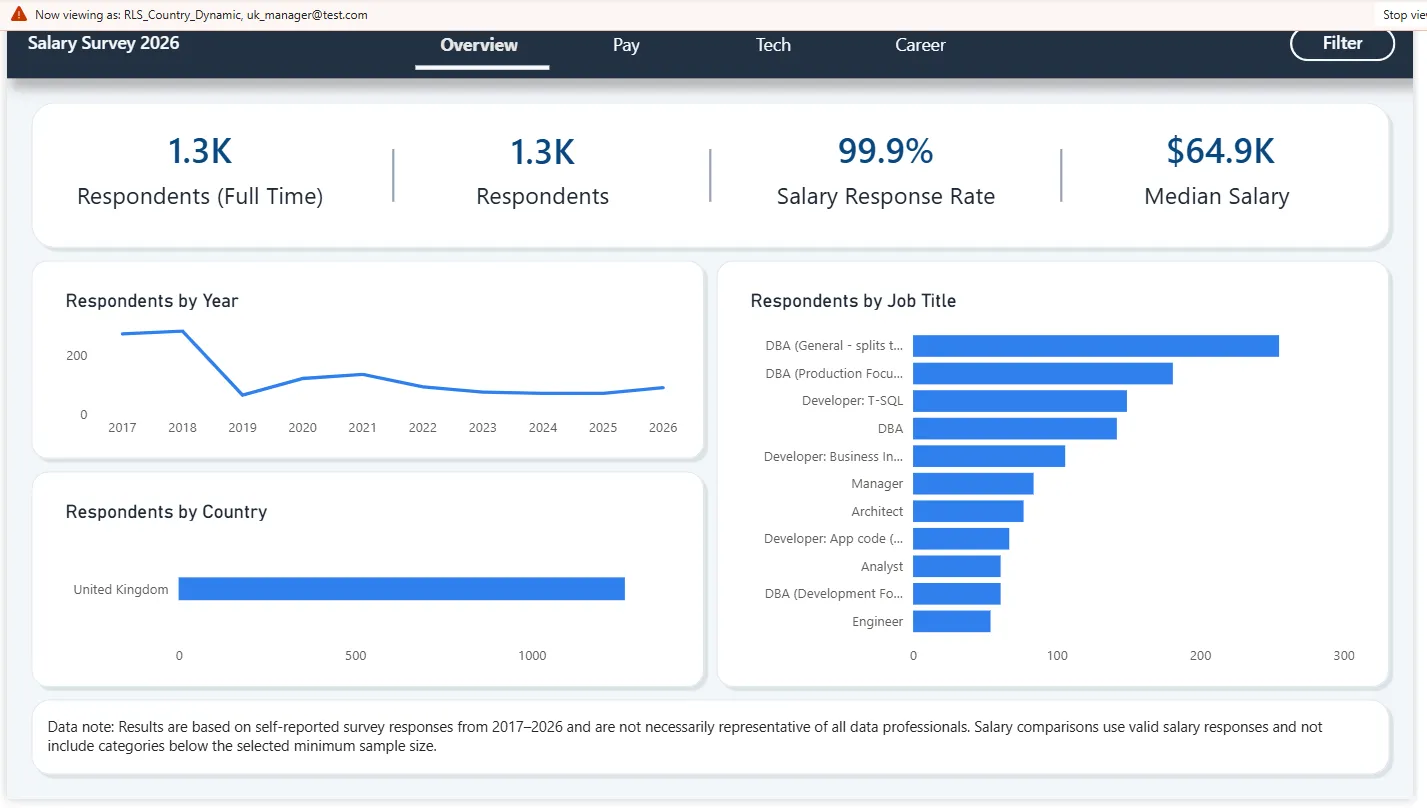
The report includes an example of dynamic country-based RLS. security_user_country maps a user email address to one or more countries, and the security role filters that table using USERPRINCIPALNAME(). The resulting country filter propagates into the survey model.
Important limitations include:
- survey responses are self-reported,
- the dataset is heavily concentrated in the United States,
- DBA-related roles form a large part of the responses,
- reported salaries are not adjusted for purchasing power or cost of living,
- hosting was optional and has a lower response rate,
- hosting selections overlap,
- some demographic values are excluded from selected visuals for readability,
- salary and experience patterns are descriptive rather than causal.