Case study 01 / 03
Retail Reporting& Analysis/SQL
Overview
PortfolioRetailLab is a SQL Server project built to practise reporting and analytical work that is closer to real BI and data-analysis use than isolated SQL exercises.
The source is a provided synthetic retail database. My contribution focused on defining reporting logic, building reusable views, validating outputs and answering business questions across sales, customers, products, fulfilment, returns and web activity.
- Contribution
- Reporting-layer development, metric definitions, analytical querying, reconciliation and data-quality auditing.
- Deliverables
- Reusable reporting, dimension-style and audit views
- A documented set of 25 analytical SQL questions
- Metric definitions, assumptions and validation logic
- Primary tools
- SQL Server · T-SQL · SSMS
- Resources
- View repository
Project Context
PortfolioRetailLab began as a SQL practice database, but I developed it into a more realistic reporting and analysis project. The objective was to work with consistent metric definitions, reusable reporting outputs and analytical questions that resemble day-to-day BI and data-analysis responsibilities.
The source contains commercial transactions, customers, products, price history, fulfilment, returns and digital activity. This supports analysis across several business domains without reducing the project to disconnected query exercises.
Data Landscape & Reporting Layer
The database is separated into domains for sales, customer data, reference data, store operations, logistics, web activity and utility tables. Important grains include one row per order, order line, customer, shipment, return, web session and web event.
I added a reporting schema above those source domains. It contains KPI views, audit and reconciliation outputs, customer-profile logic and reusable category mappings.
Provided source data
- Sales and order lines
- Customers and history
- Products and categories
- Shipments and returns
- Web sessions and events
- Calendar and reference data
Reporting layer
- Daily and monthly KPIs
- Reconciliation views
- Operational audits
- Customer profiles
- Category hierarchy mappings
Analytical outputs
- 25-question SQL set
- Customer cohorts
- Product analysis
- Fulfilment reporting
- Web conversion analysis
Reusable views prevent the same business definition from being rebuilt differently in every question. Analytical files can therefore focus on their specific question while drawing from a consistent reporting foundation.
KPI Backbone & Reconciliation
The daily KPI view uses the calendar table as a date spine, so the output can include observable dates with no orders. Order-line values are aggregated to order level before joining to order headers, preventing shipping amounts from being duplicated across multiple lines.
The canonical sales scope uses delivered orders and the order date as the reporting date. Net sales combines line-level net amounts with order-level shipping.
Daily KPI backbone
reporting.v_kpi_daily centralises the recurring sales logic:
-- Selected excerpt from reporting.v_kpi_daily

WITH OrderLineAgg AS
(
    SELECT
        sol.SalesOrderID,
        SUM(sol.GrossAmount) AS GrossSales,
        SUM(sol.DiscountAmount) AS DiscountTotal,
        SUM(sol.TaxAmount) AS TaxTotal,
        SUM(sol.NetAmount) AS LinesNetSales
    FROM sales.SalesOrderLine sol
    GROUP BY sol.SalesOrderID
)
SELECT
    cd.[Date],
    COUNT(so.SalesOrderID) AS TotalOrders,
    SUM(
        CASE WHEN so.OrderStatusCode = 'DELIVERED'
            THEN 1 ELSE 0
        END
    ) AS DeliveredOrders,
    SUM(
        CASE WHEN so.OrderStatusCode = 'DELIVERED'
            THEN COALESCE(ola.LinesNetSales, 0)
               + COALESCE(so.ShippingAmount, 0)
            ELSE 0
        END
    ) AS NetSales
FROM util.CalendarDate cd
LEFT JOIN sales.SalesOrder so
    ON so.OrderDate >= cd.[Date]
    AND so.OrderDate < DATEADD(DAY, 1, cd.[Date])
LEFT JOIN OrderLineAgg ola
    ON ola.SalesOrderID = so.SalesOrderID
GROUP BY cd.[Date];
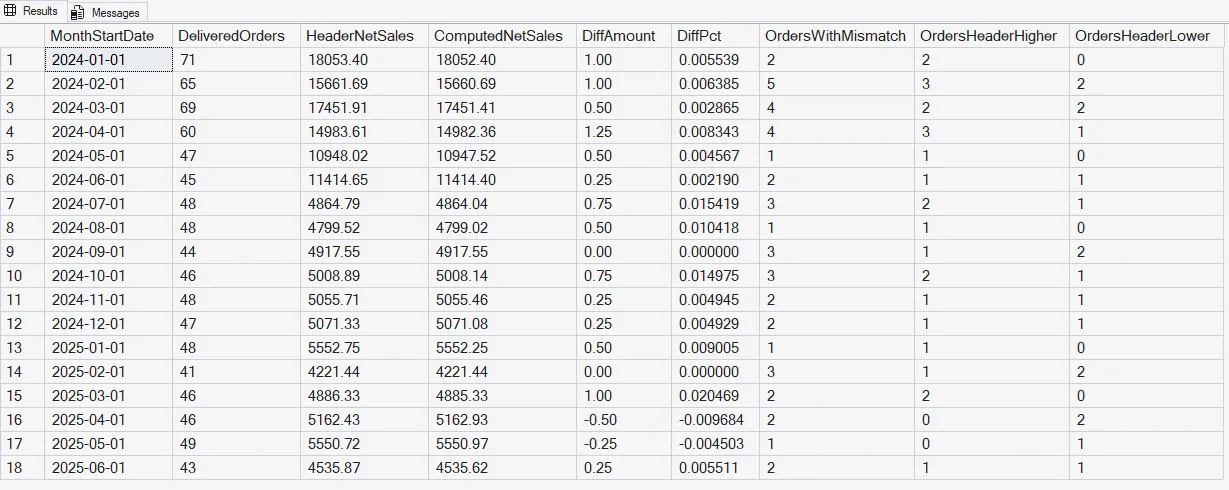
Header-versus-computed reconciliation
The order header total is treated as a comparison value rather than the canonical KPI source. The audit recomputes net sales from order lines and shipping, then reports monthly differences and mismatch direction.
-- Selected excerpt from the monthly reconciliation view

SELECT
    ms.MonthStartDate,
    COALESCE(ma.DeliveredOrders, 0) AS DeliveredOrders,
    COALESCE(ma.HeaderNetSales, 0.00) AS HeaderNetSales,
    COALESCE(ma.ComputedNetSales, 0.00) AS ComputedNetSales,
    COALESCE(ma.HeaderNetSales, 0.00)
        - COALESCE(ma.ComputedNetSales, 0.00) AS DiffAmount,
    CAST(
        (
            COALESCE(ma.HeaderNetSales, 0.00)
            - COALESCE(ma.ComputedNetSales, 0.00)
        ) * 100
        / NULLIF(COALESCE(ma.ComputedNetSales, 0.00), 0.00)
        AS DECIMAL(18, 6)
    ) AS DiffPct,
    COALESCE(ma.OrdersWithMismatch, 0) AS OrdersWithMismatch,
    COALESCE(ma.OrdersHeaderHigher, 0) AS OrdersHeaderHigher,
    COALESCE(ma.OrdersHeaderLower, 0) AS OrdersHeaderLower
FROM MonthSpine ms
LEFT JOIN MonthlyAgg ma
    ON ma.MonthStartDate = ms.MonthStartDate;
NULLIF prevents division by zero, while the mismatch counts show whether differences are isolated or recurring.
Cohort Retention
Customers are assigned to the month of their first delivered order. Activity is reduced to one row per customer and month before retention is calculated, preventing customers with several monthly orders from being counted repeatedly.
The output uses long format with one row per cohort and MonthIndex. Trailing cohorts only return periods that could actually have been observed. Future months are not filled with artificial zeroes.
-- Selected excerpt from Q11 cohort retention

ObservableCohortMonths AS
(
    SELECT
        cs.CohortMonth,
        cs.CohortSize,
        mi.MonthIndex
    FROM CohortSize cs
    CROSS JOIN MonthIndexes mi
    CROSS JOIN MaxObservedMonth mom
    WHERE mi.MonthIndex <= DATEDIFF(
        MONTH,
        cs.CohortMonth,
        mom.MaxOrderMonth
    )
)
SELECT
    ocm.CohortMonth,
    ocm.MonthIndex,
    COUNT(DISTINCT ca.CustomerID) AS ActiveCustomers,
    ocm.CohortSize,
    CAST(
        COUNT(DISTINCT ca.CustomerID) * 100.0
        / NULLIF(ocm.CohortSize, 0)
        AS DECIMAL(18, 2)
    ) AS RetentionPct
FROM ObservableCohortMonths ocm
LEFT JOIN CustomerActivity ca
    ON ca.CohortMonth = ocm.CohortMonth
    AND ca.MonthIndex = ocm.MonthIndex
GROUP BY
    ocm.CohortMonth,
    ocm.MonthIndex,
    ocm.CohortSize;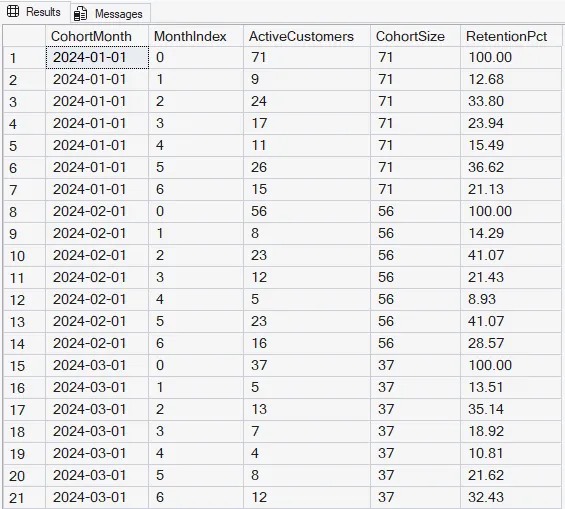
Price-at-Time-of-Sale Validation
Current product prices cannot validate historical transactions reliably. Each order line must instead be matched to the price record that was effective on its order date.
The query uses OUTER APPLY so unmatched order lines remain visible. When overlapping history rows exist, TOP 1 with the latest EffectiveFrom selects the most recent valid record.
-- Selected excerpt from Q17 price validation

OUTER APPLY
(
    SELECT TOP 1
        ph.ListPrice
    FROM ref.ProductListPriceHistory ph
    WHERE ph.ProductID = pold.ProductID
        AND pold.OrderDate >= ph.EffectiveFrom
        AND (
            pold.OrderDate <= ph.EffectiveTo
            OR ph.EffectiveTo IS NULL
        )
    ORDER BY ph.EffectiveFrom DESC
) plph
The matched price is then compared with the unit price used on the order line. Separate flags distinguish missing historical matches from genuine price discrepancies.
CASE
    WHEN plph.ListPrice IS NOT NULL THEN 1
    ELSE 0
END AS HasPriceMatch,

CASE
    WHEN plph.ListPrice IS NOT NULL
        AND ABS(pold.UnitPrice - plph.ListPrice) > 0.01
        THEN 1
    ELSE 0
END AS IsDiscrepant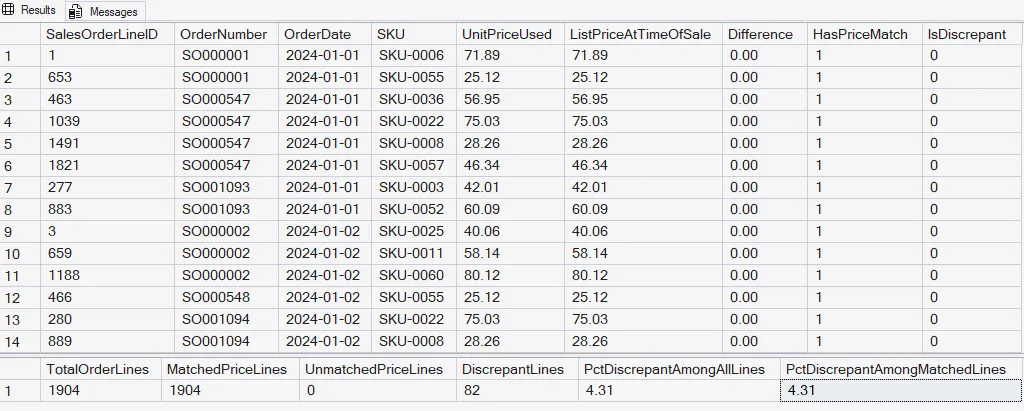
Technical Decisions & Limitations
Several decisions were applied consistently across the project:
- Sales KPIs use delivered orders and order date unless a question explicitly defines another scope.
- Average order value remains
NULLwhen there are no delivered orders because the value is undefined rather than zero. - Product and category reporting excludes shipping because no product-level allocation rule was defined.
- Customer activity is reduced to the correct analytical grain before cohort calculations.
- Effective-dated customer and price records are matched against the relevant historical date.
- Reporting views are reused instead of copying the same metric logic into every question.
The wider question set also covers channel mix, store contribution, customer lifetime value, repeat purchasing, Pareto analysis, category hierarchy, shipping performance, returns, refunds, A/B conversion and funnel analysis.