Case study 03 / 03
TV SeriesConvention Analysis/Excel
Overview
This Excel 365 workbook records convention timing at episode level and turns those inputs into validated episode- and series-level reporting.
The project combines structured data entry, duration conversion, calculated measures, arithmetic quality checks, runtime-weighted and unweighted summaries, PivotTables, PivotCharts and interactive dashboards.
- Contribution
- Workbook architecture, formula development, quality-control logic, summary methodology and dashboard development.
- Deliverables
- Episode-level data-entry and calculation system
- Series-level weighted and unweighted summaries
- Interactive series and episode dashboards
- Primary tools
- Excel 365 · Formulas · PivotTables · PivotCharts
- Resources
- View repositoryDownload workbookXLSX
Workbook Requirements & Data Entry
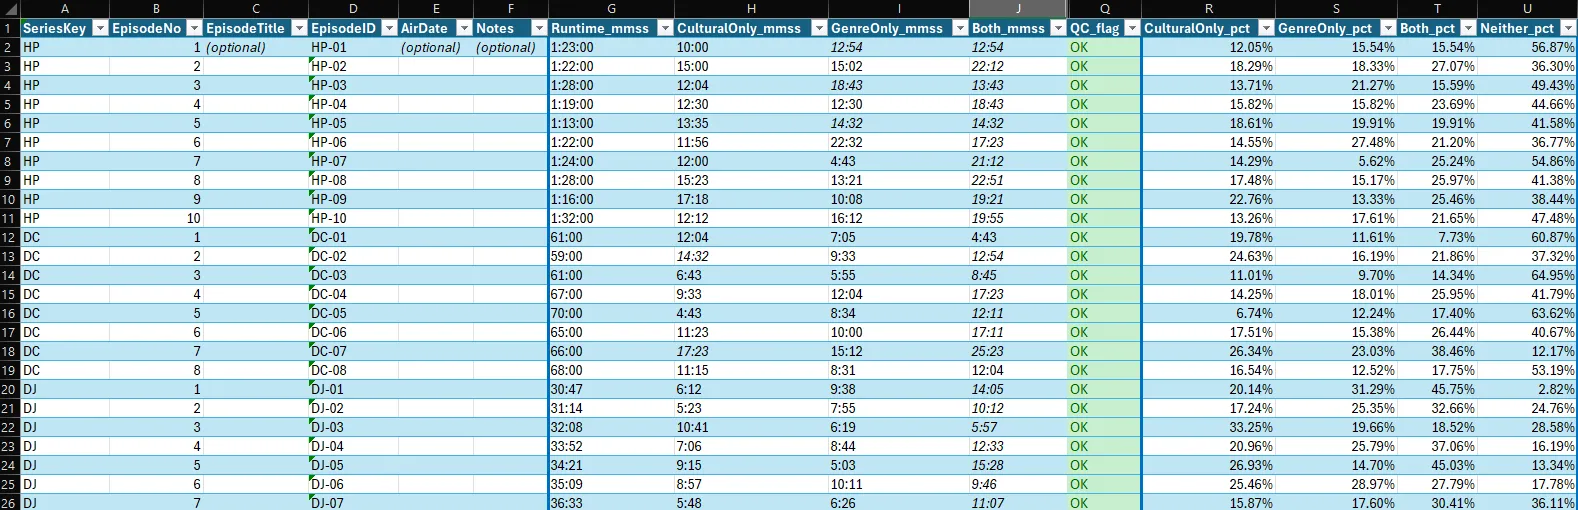
The workbook was designed to support repeatable episode-level coding rather than one-off calculations. One row represents one episode and stores identifying information, runtime, notes and manually entered convention durations.
The four runtime categories are:
CulturalOnlyGenreOnlyBothNeither
CulturalOnly, GenreOnly and Both are entered by the user. The workbook converts the duration inputs, calculates Neither and produces percentages and overlapping presence measures.
Workbook Structure
The workbook separates data entry, calculation, summary and presentation while keeping them connected through Excel Tables and refreshable reporting.
Episode input
- Episode identifiers
- Runtime
- Convention durations
- Notes
Calculation & QC
- Duration conversion
- Neither calculation
- Presence measures
- QC status
- Series summaries
Reporting
- Series dashboard
- Episode dashboard
- PivotTables
- PivotCharts
- Slicers
Modern Excel functions including LAMBDA, LET, FILTER, SUMIFS, COUNTIFS, STDEV.S and XLOOKUP support reusable calculations and summary logic.
Calculation Logic
The four mutually exclusive categories form a complete episode-runtime partition:
CulturalOnly + GenreOnly + Both + Neither = Runtime
Neither is calculated as the remaining runtime after the three manually coded categories are removed.
The workbook also calculates two overlapping measures:
- Cultural Presence =
CulturalOnly + Both - Genre Presence =
GenreOnly + Both
These measures answer a different question from the exclusive partition. Because Both contributes to each presence measure, Cultural Presence plus Genre Presence can exceed 100%.
The episode-level ratio compares only exclusive convention time:
CulturalOnly / GenreOnly
Both is excluded because it represents shared rather than exclusive time. The ratio remains blank when GenreOnly is zero or missing.
Quality Control
The QC_flag checks whether the manually entered convention durations are arithmetically consistent with the episode runtime.
Possible results include:
- blank when no episode data has been entered,
MISSING RUNTIMEwhen convention time exists without a runtime,OVERwhen entered convention durations exceed runtime by more than five seconds,OKwhen the entered values remain within the accepted tolerance.
The five-second tolerance avoids treating minor timing and conversion differences as material overcoding.
Summary Methodology
The Series sheet reduces episode-level data to one row per series and calculates episode count, total runtime, category durations, presence measures and variation.
It provides two kinds of percentage:
Runtime-weighted shares
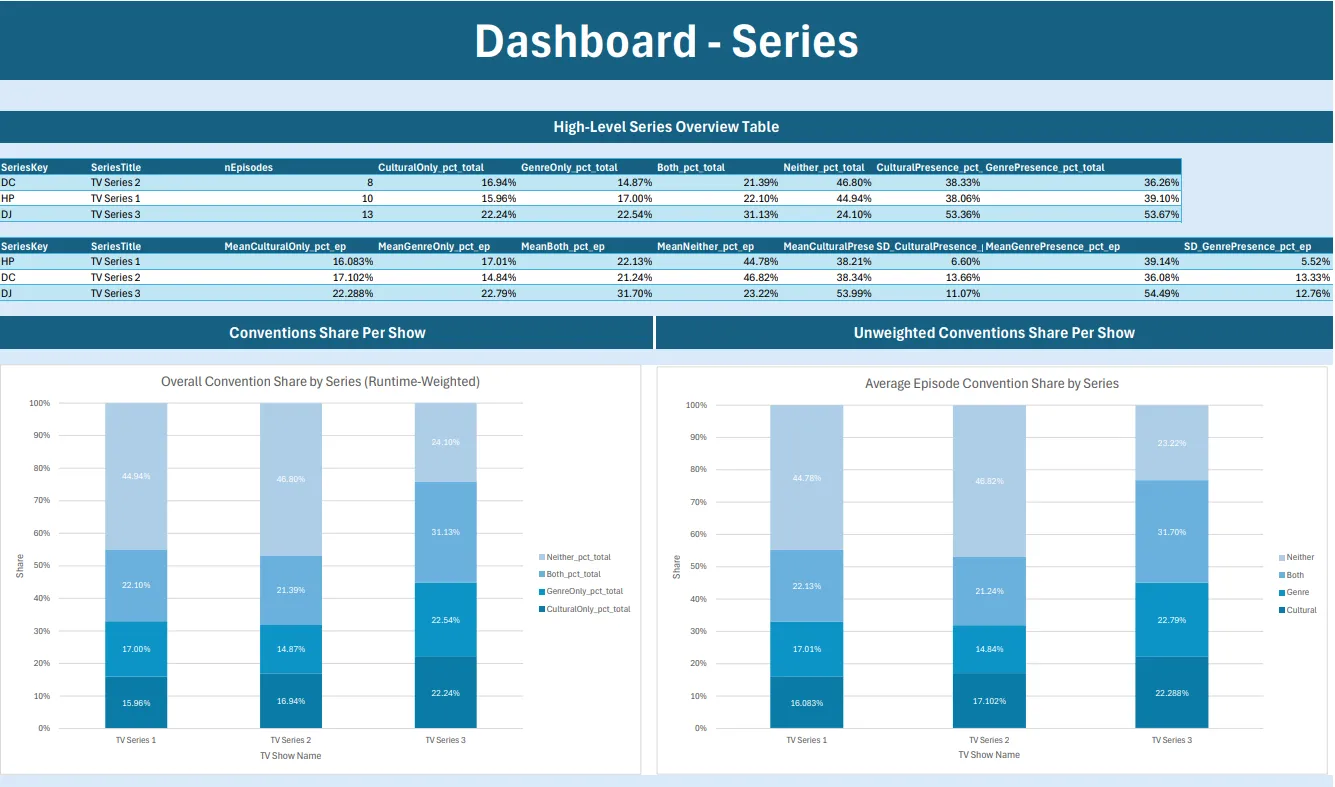
Durations are summed across all episodes before percentages are calculated. Longer episodes contribute more to the result. These measures describe the overall runtime composition of a series.
Average episode shares
Episode percentages are averaged so each episode contributes equally, regardless of runtime. These measures describe the composition of a typical episode.
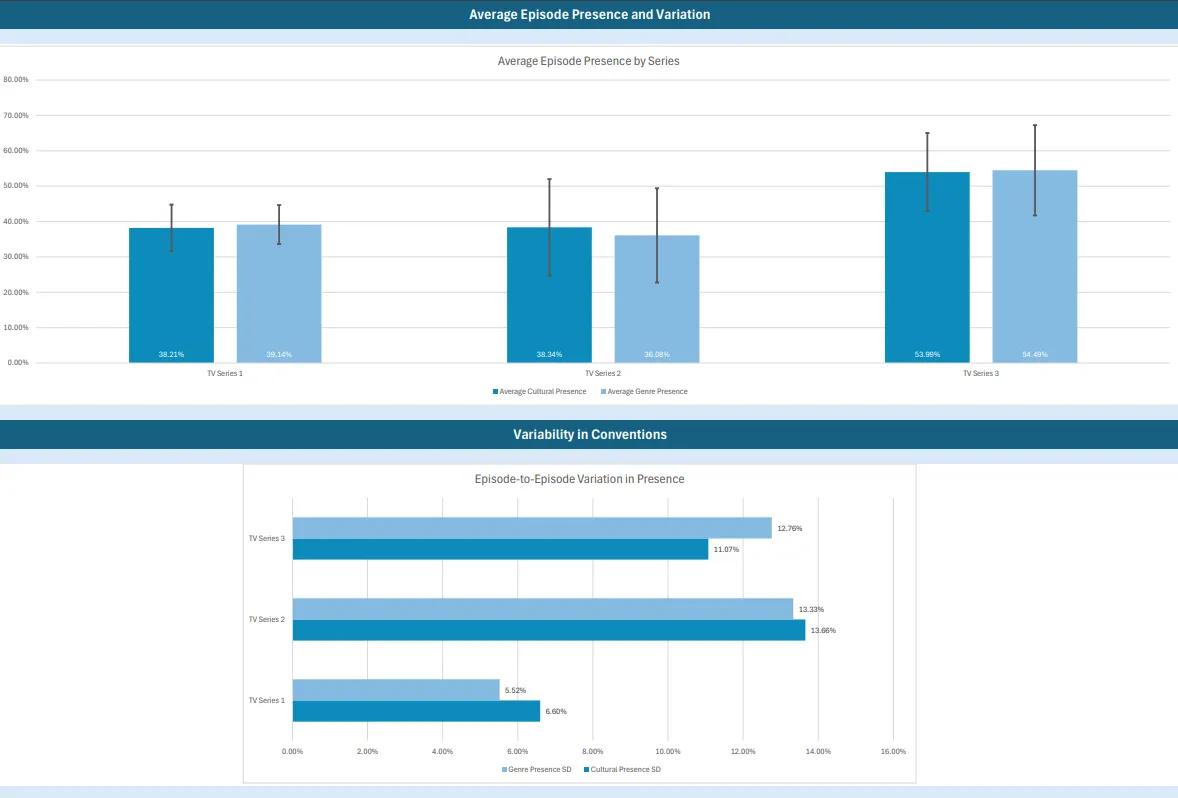
Standard deviation of episode-level presence measures adds information about how consistent or variable a series is across episodes.


Dashboard Experience
The workbook contains separate dashboards for series-level and episode-level analysis.
Series dashboard
The series view compares runtime-weighted composition, average episode composition and variation in Cultural and Genre Presence.
Episode dashboard
The episode view uses a SeriesKey slicer to switch between series. It compares category shares, presence measures and the Cultural Only to Genre Only ratio across episodes.
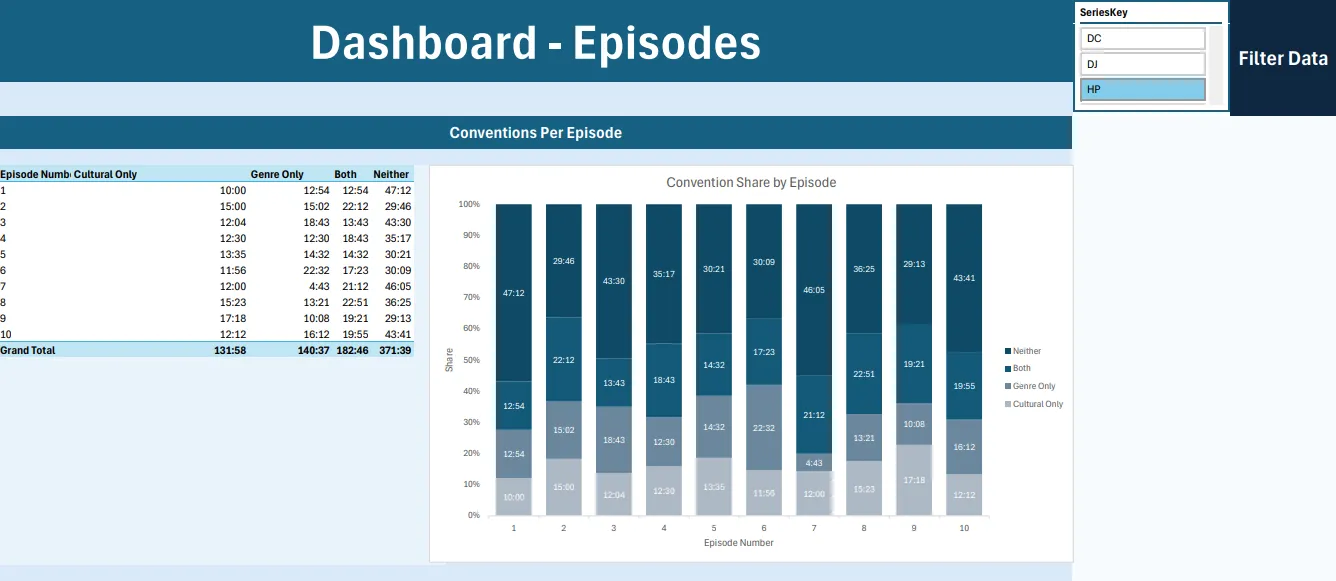
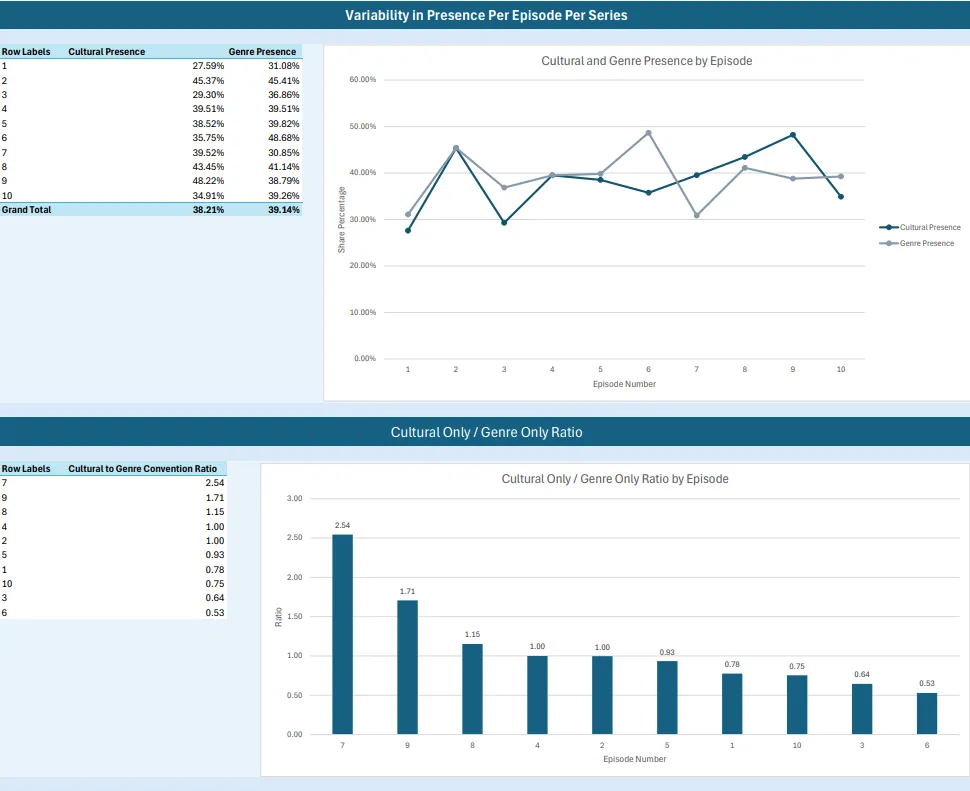
After the input table changes, Data → Refresh All updates the PivotTables and dashboard visuals.
Limitations
Important boundaries of the workbook include:
- the included data is anonymised demonstration data,
- series labels are generic,
- timing values are illustrative,
- the workbook is a data-entry and reporting example rather than a formal media-research study,
- dashboard accuracy depends on the quality of the entered coding,
- QC checks arithmetic but not interpretation,
- the ratio can become very large when
GenreOnlytime is small, - modern functions make Excel 365 the recommended version.